My personal projects from 2021
December 23, 2021 by Krisztina Szucs
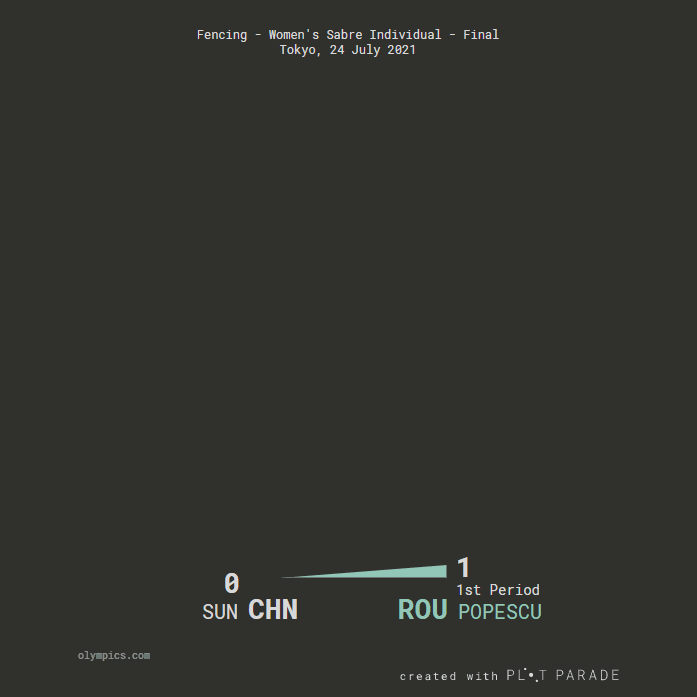
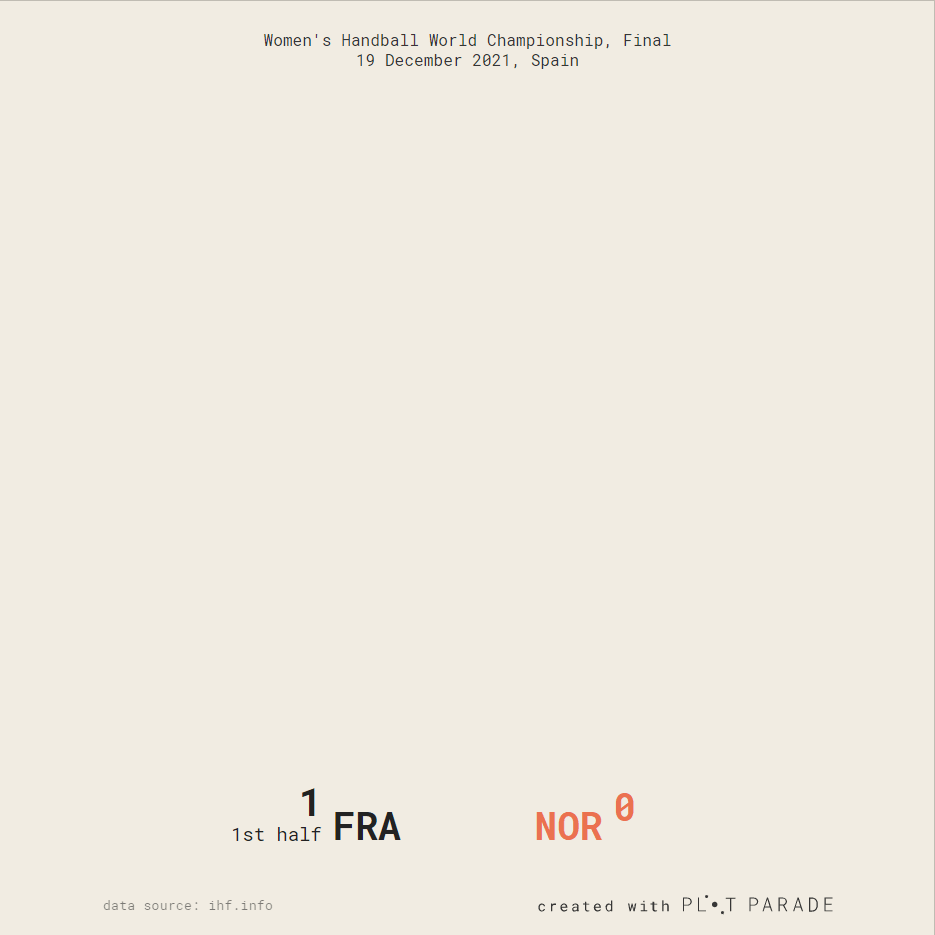
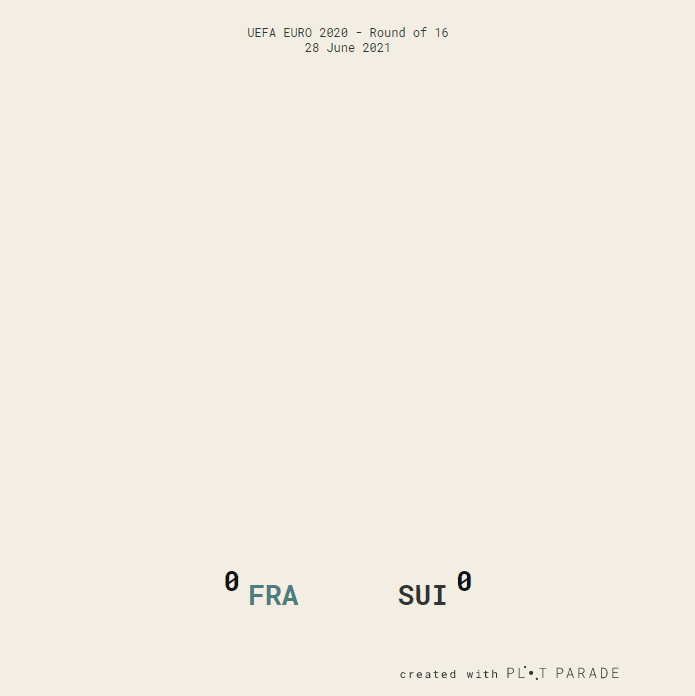
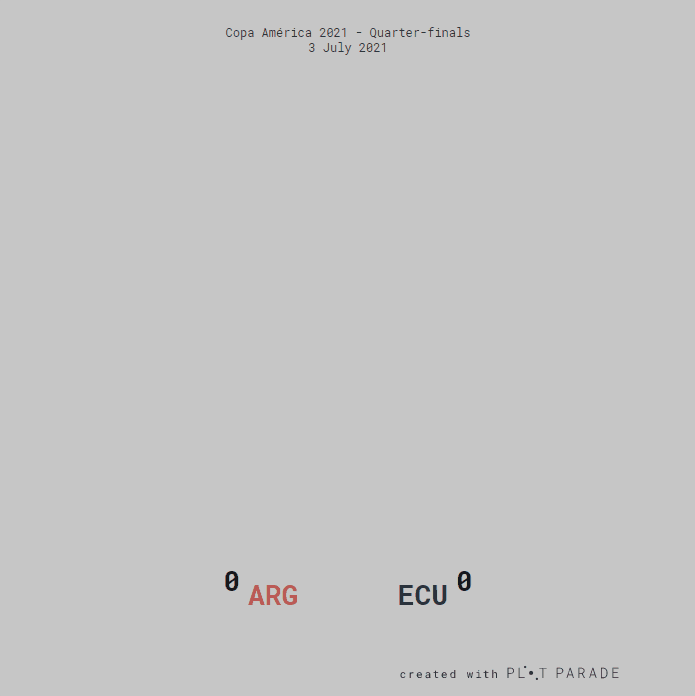
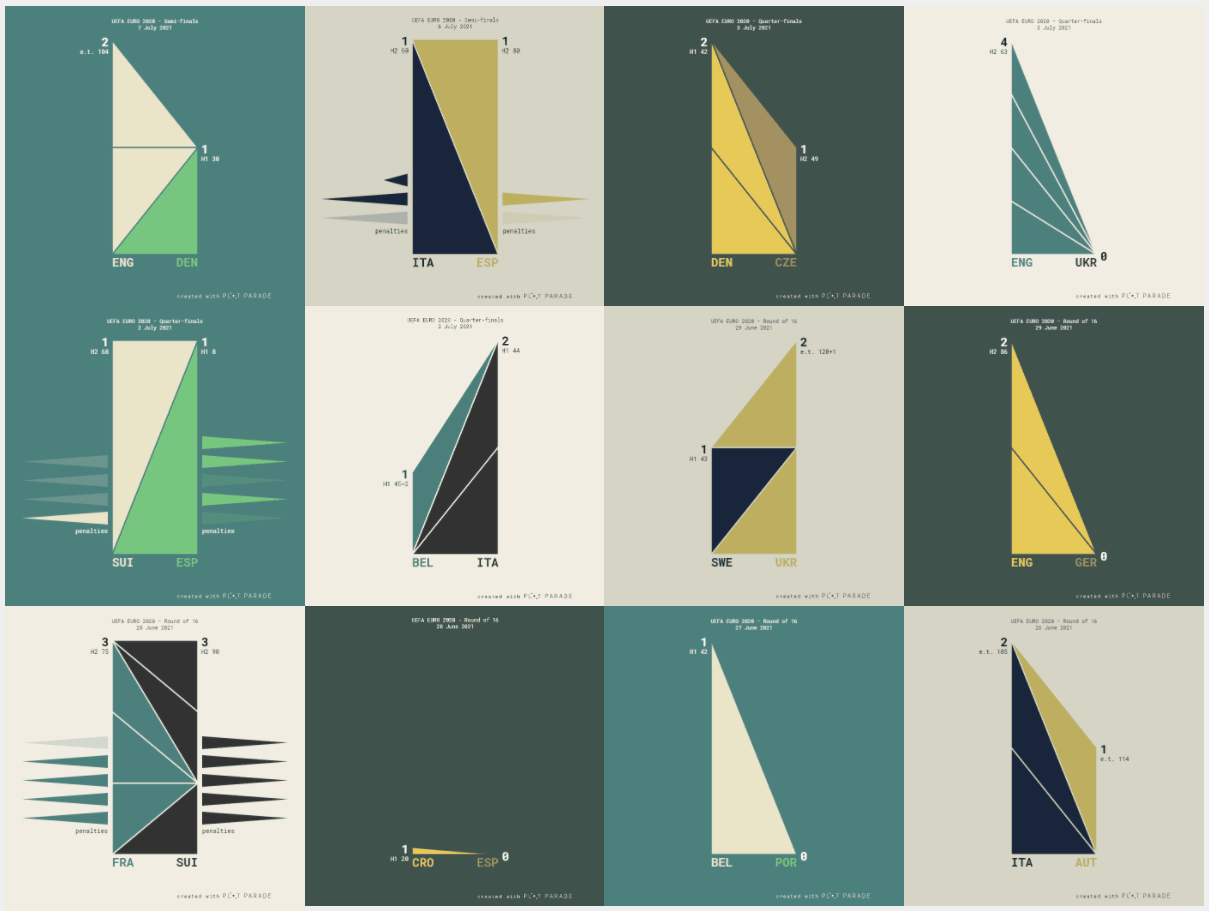
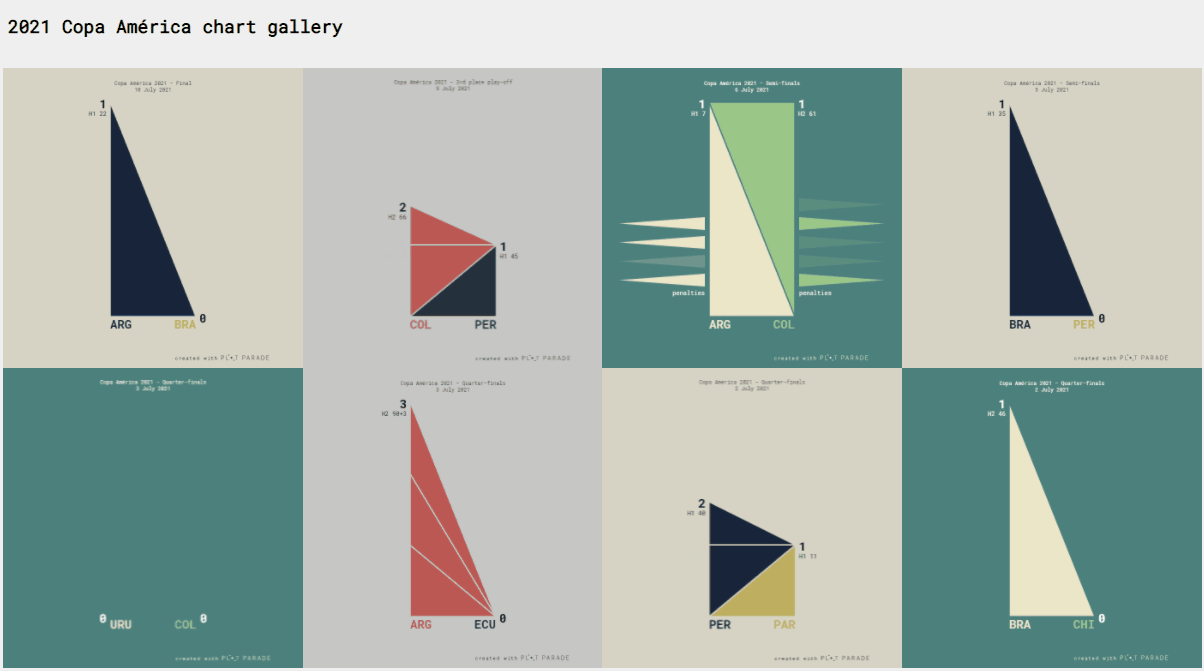
Fencing, Handball and Soccer results by using the same chart type
I created one chart and used it for several sport disciplines. I also added small modifications to make sure it works with different sports: Fencing – the two opponents can hit one another at the same moment so both get a point at the same time in the animation. Handball – A team can score 20-30 goals in a match and the two halves can look very different. I divided the chart by half time to help showing this difference. Soccer – 0-3 goals per team is pretty common. If the match ends in draw, a penalty shoot-out can happen (3rd picture).
Soccer championships – UEFA Champions League
Copa América – South American Football Championship
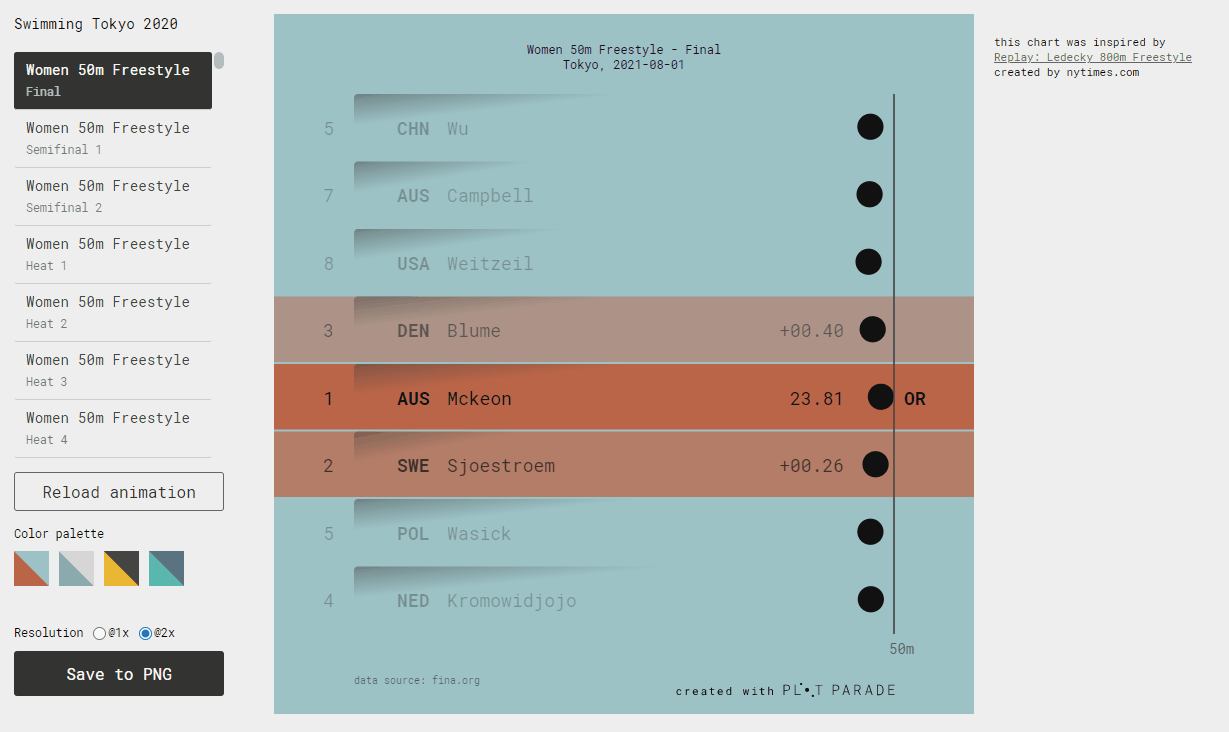
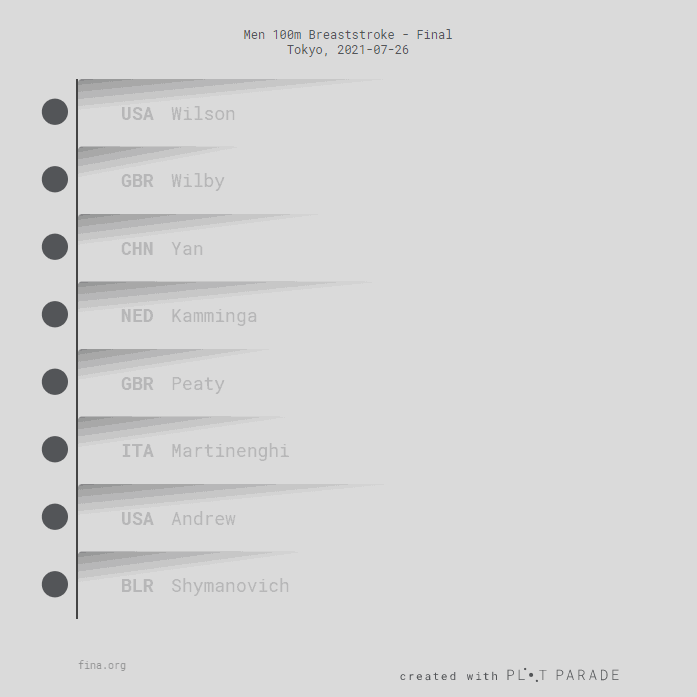
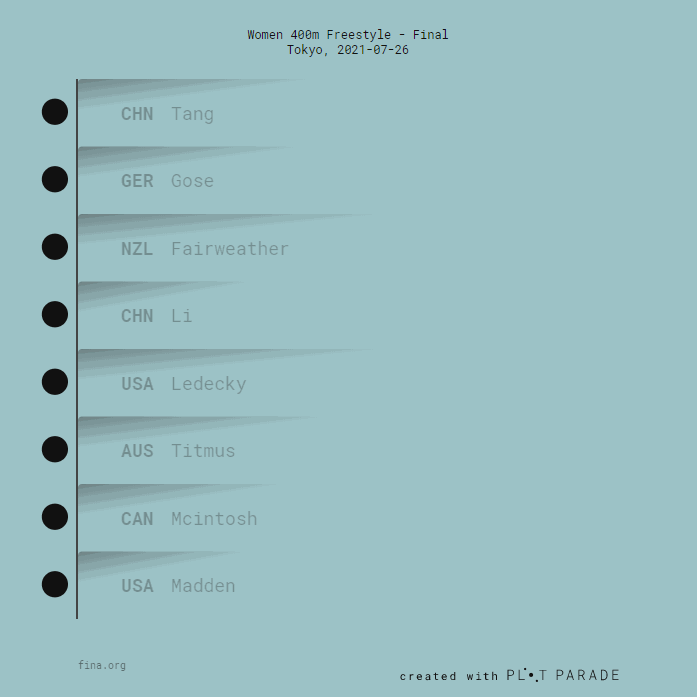
Olympic games – Swimming results
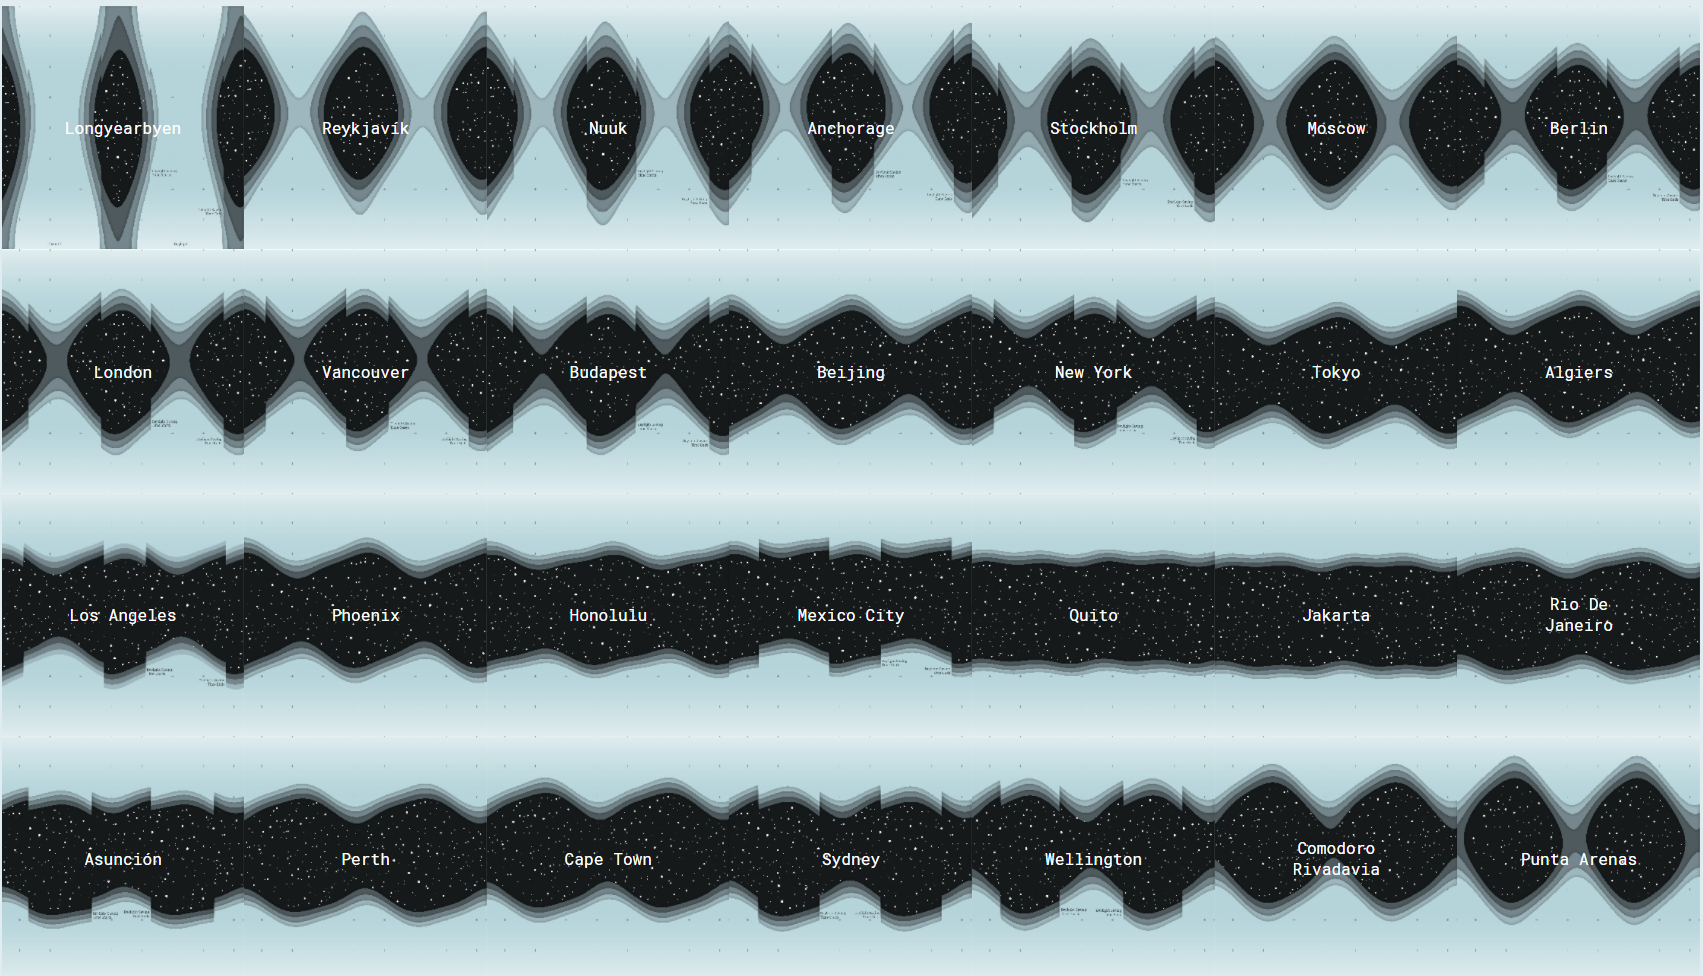
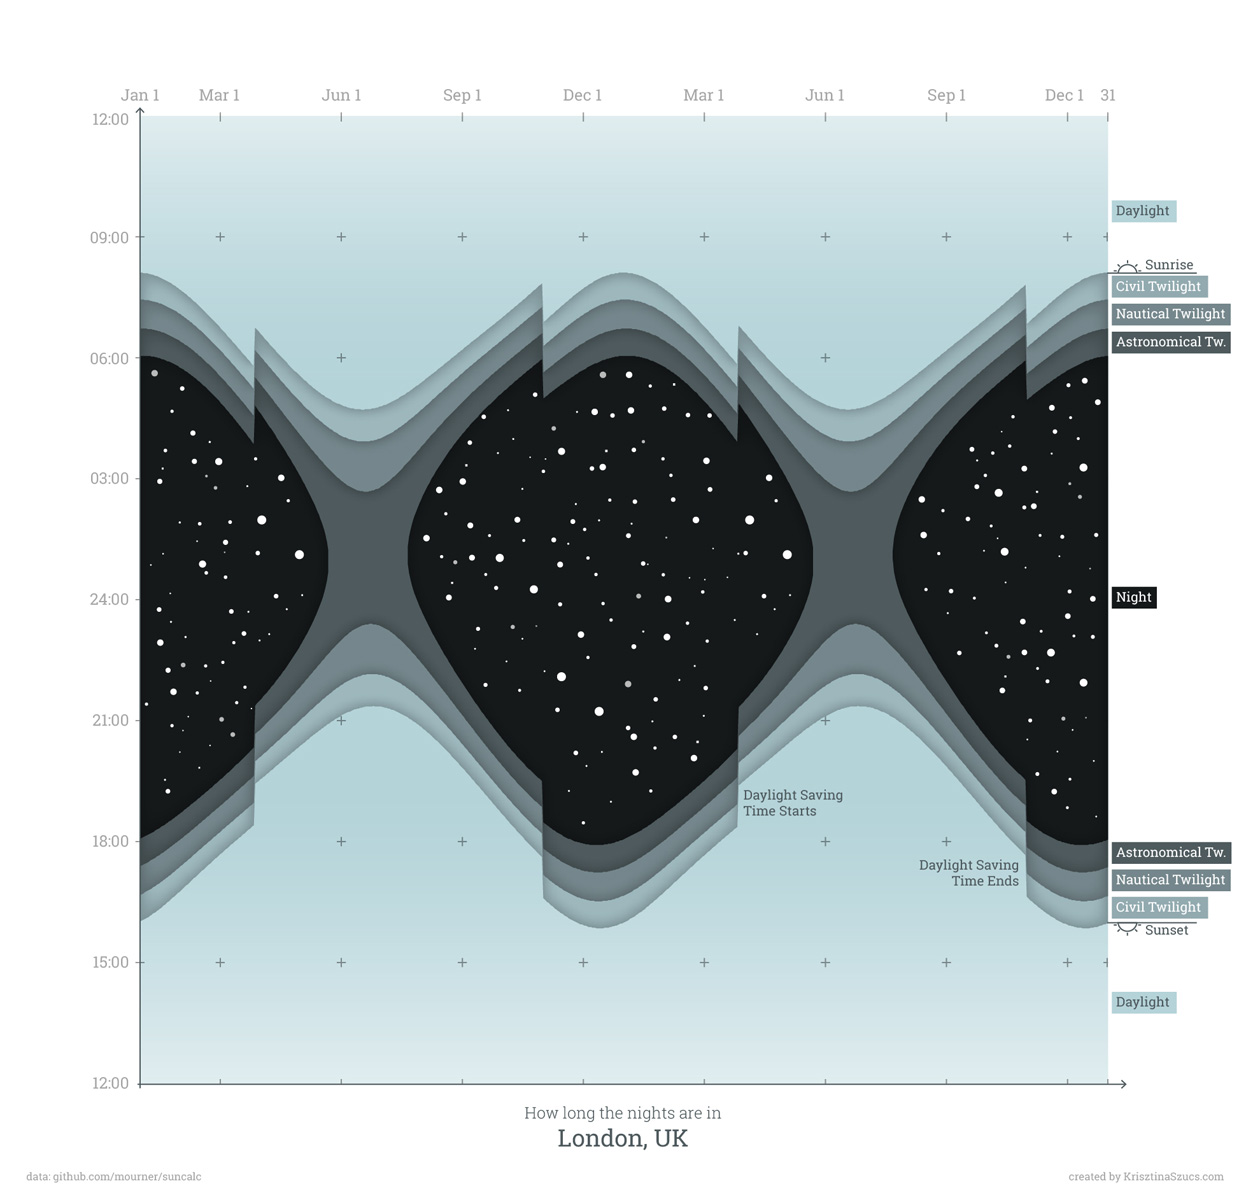
How long are the nights?
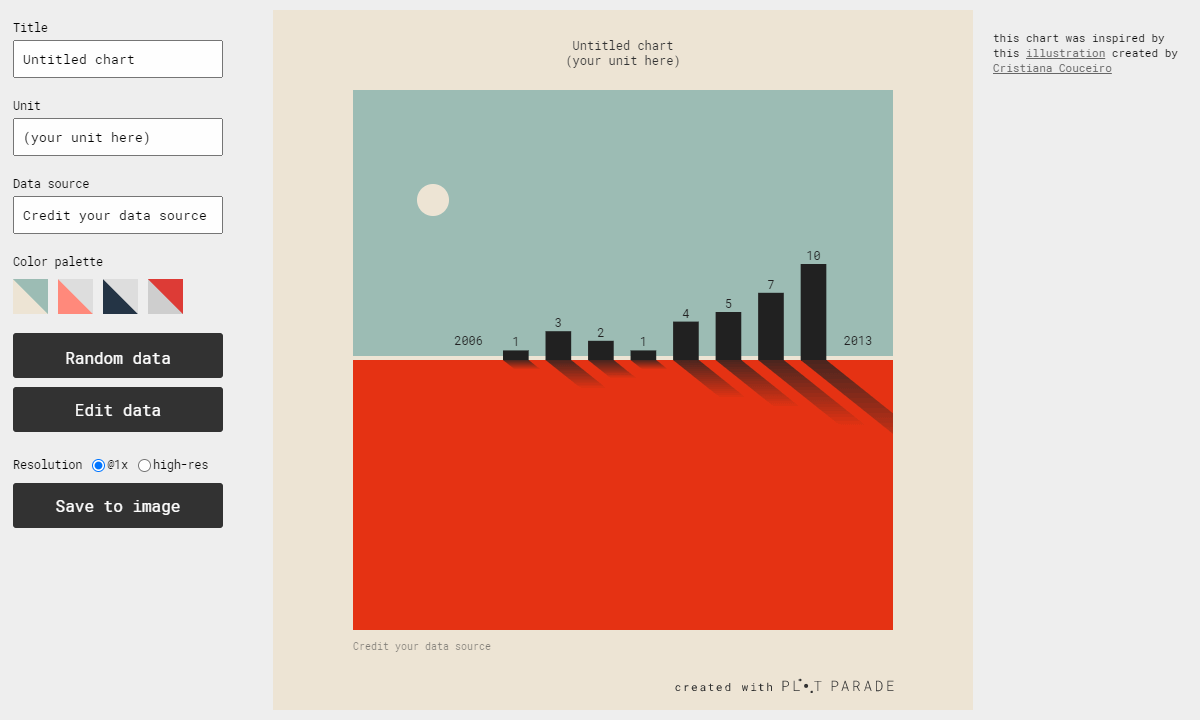
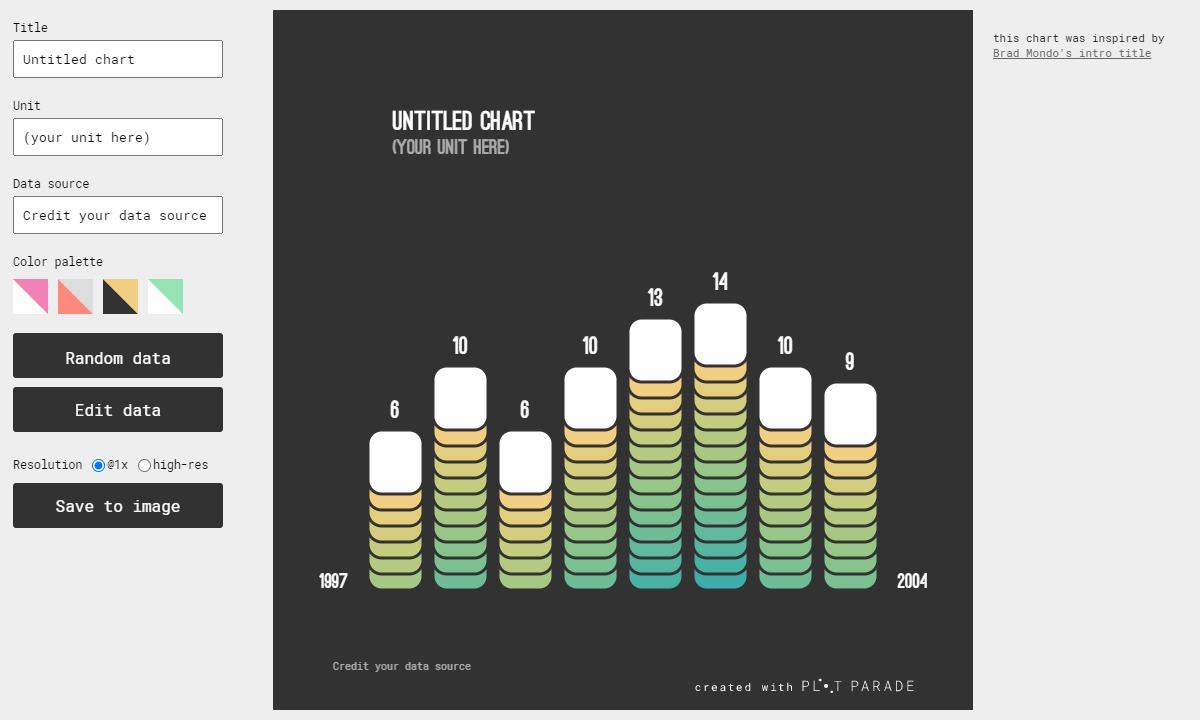
3 new editable chart designs on PlotParade
Bar chart with shadows
“PEZ” chart
Bar chart with non-zero baseline

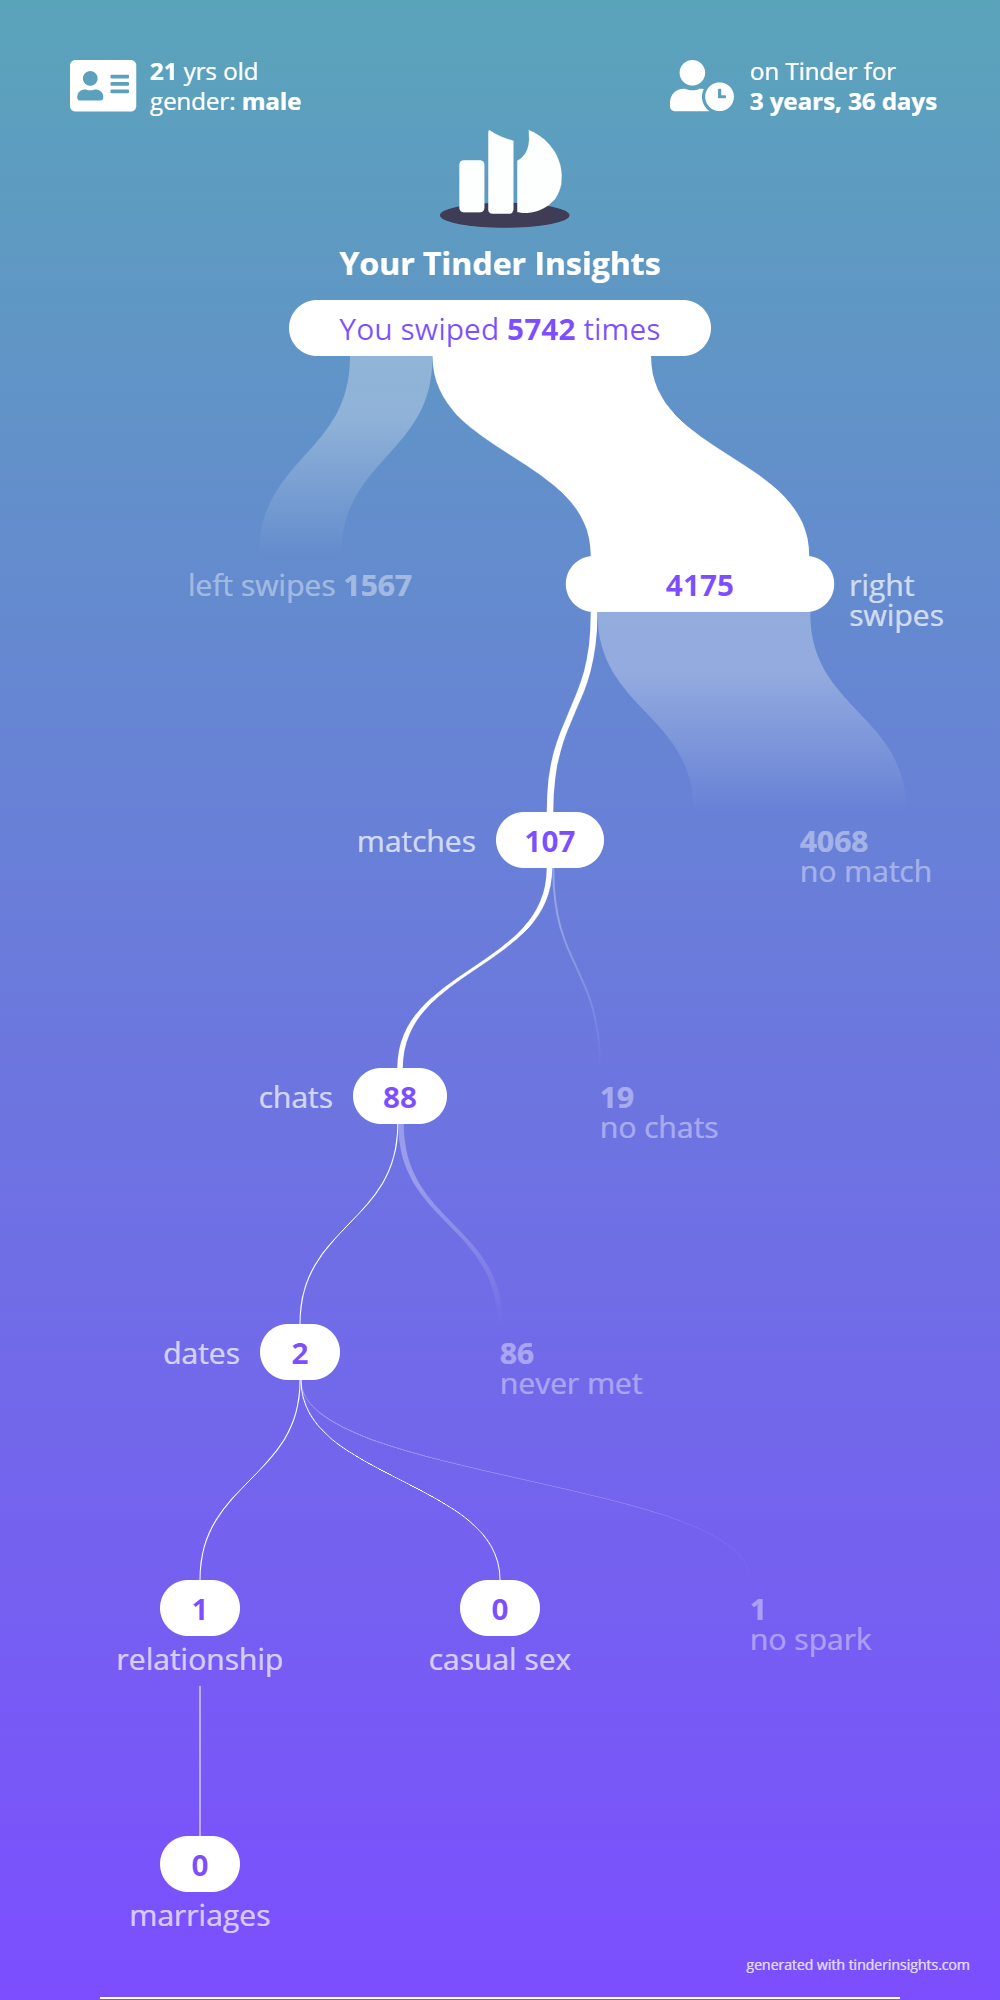
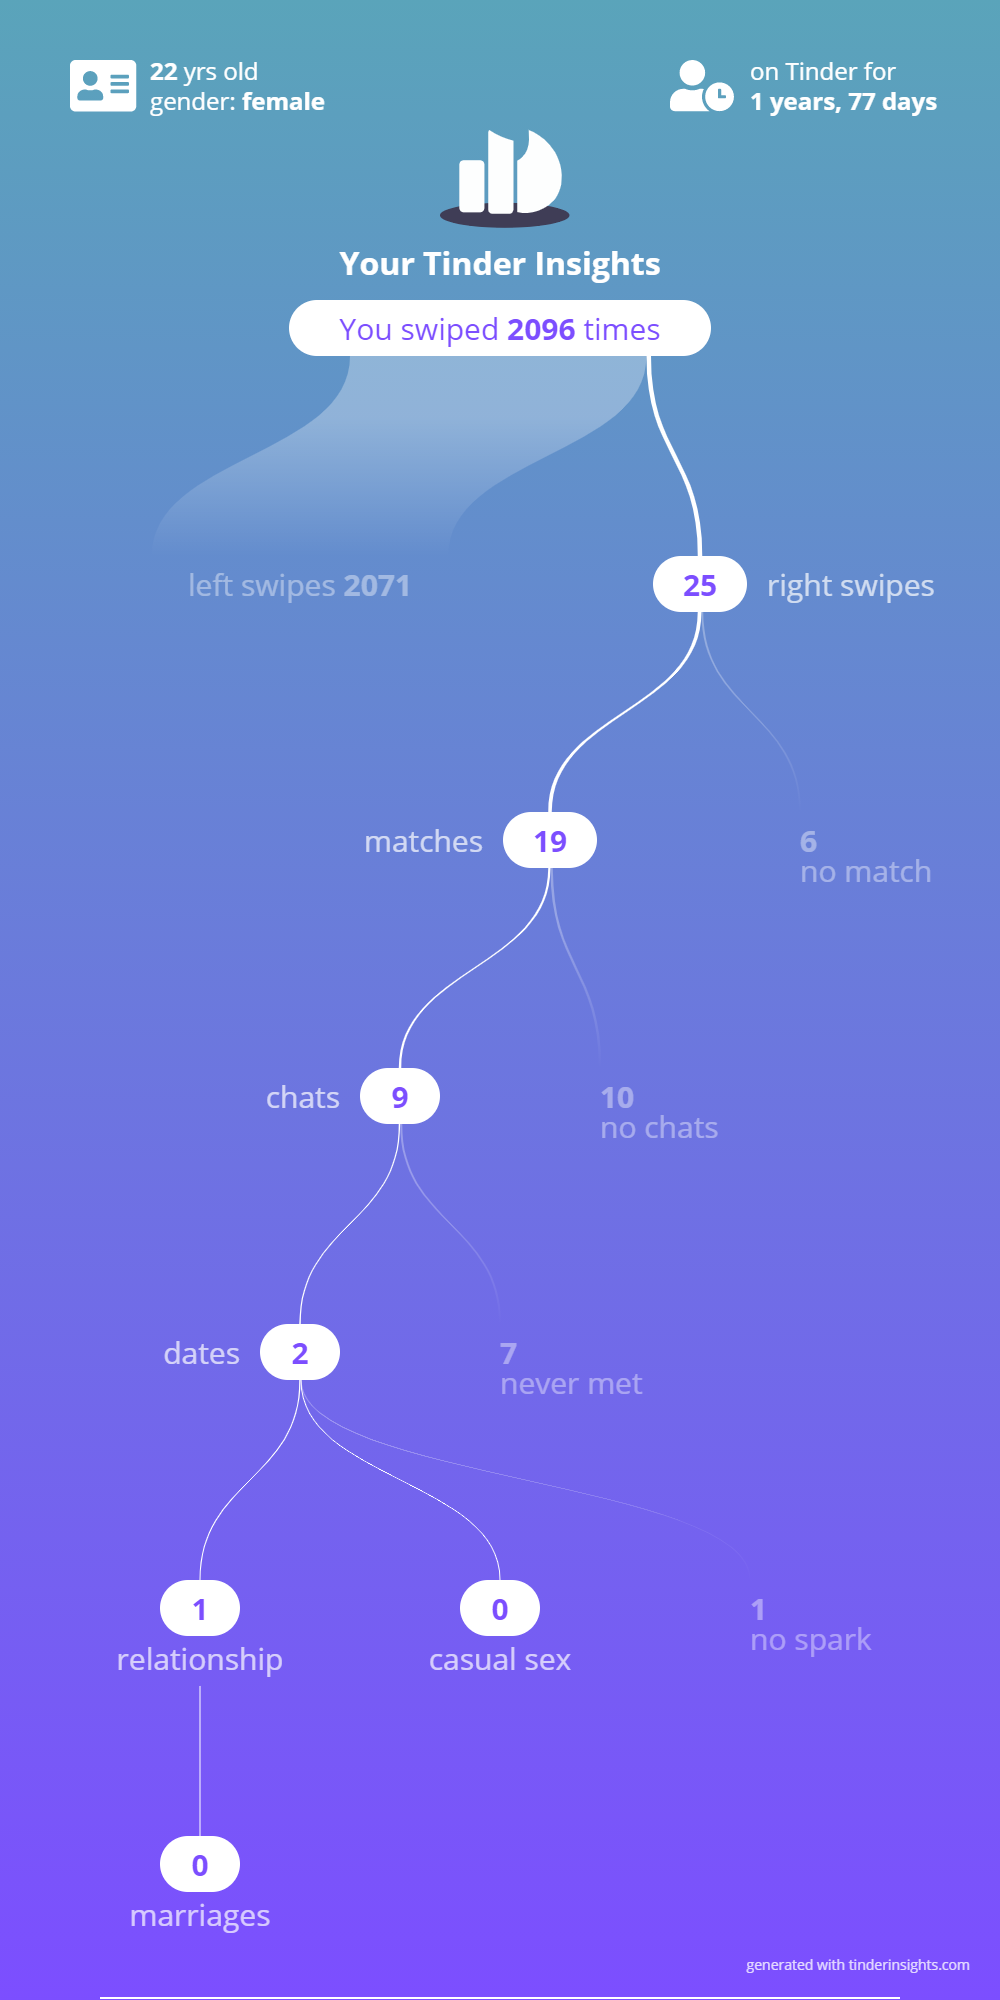
Tinder Insights
Every Tinder user has access to an insane amount of structured personal behavioral data so Dora Szucs and I created a web app where users can easily generate visualizations from those data files. Although we finished the project in December 2020, it didn’t really take off until September this year. A random reddit post got popular and suddenly we had thousands of people sharing, discussing and comparing their own Tinder data visualizations. As of today more than 14000 users have generated their personal charts with Tinder Insights.

Follow me on twitter to get a sneak peek into my latest projects: @szucsi