My personal projects from 2022
December 26, 2022 by Krisztina Szucs
Winning an Information Is Beautiful Award
The absolute highlight of my year was winning my second Information Is Beautiful Award. This time for my sport animations. Read more about the project

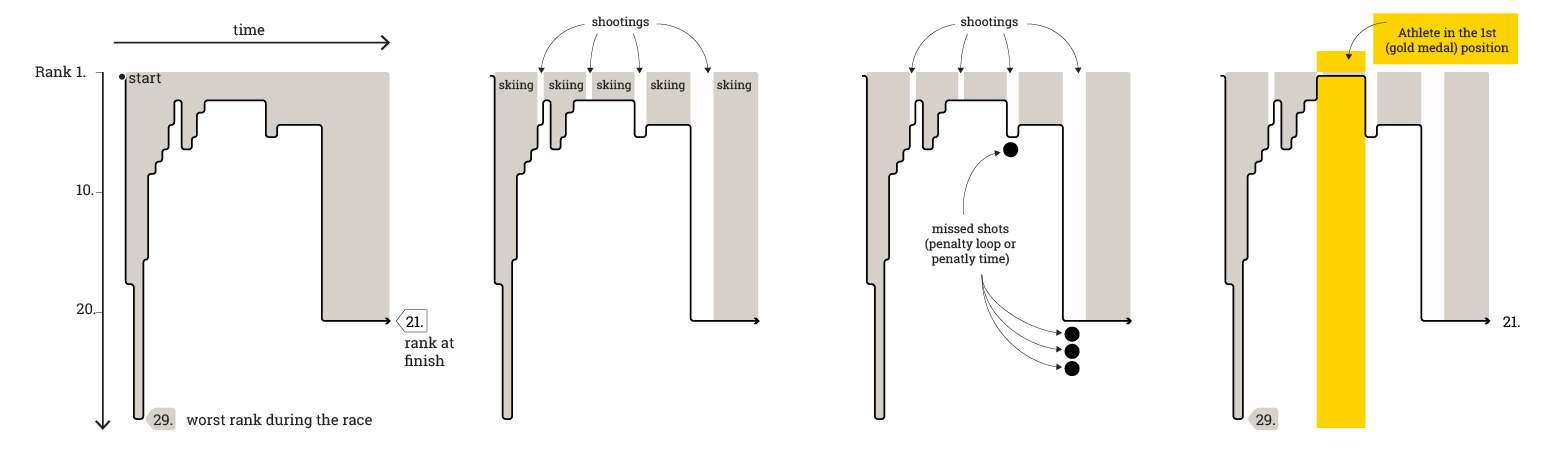
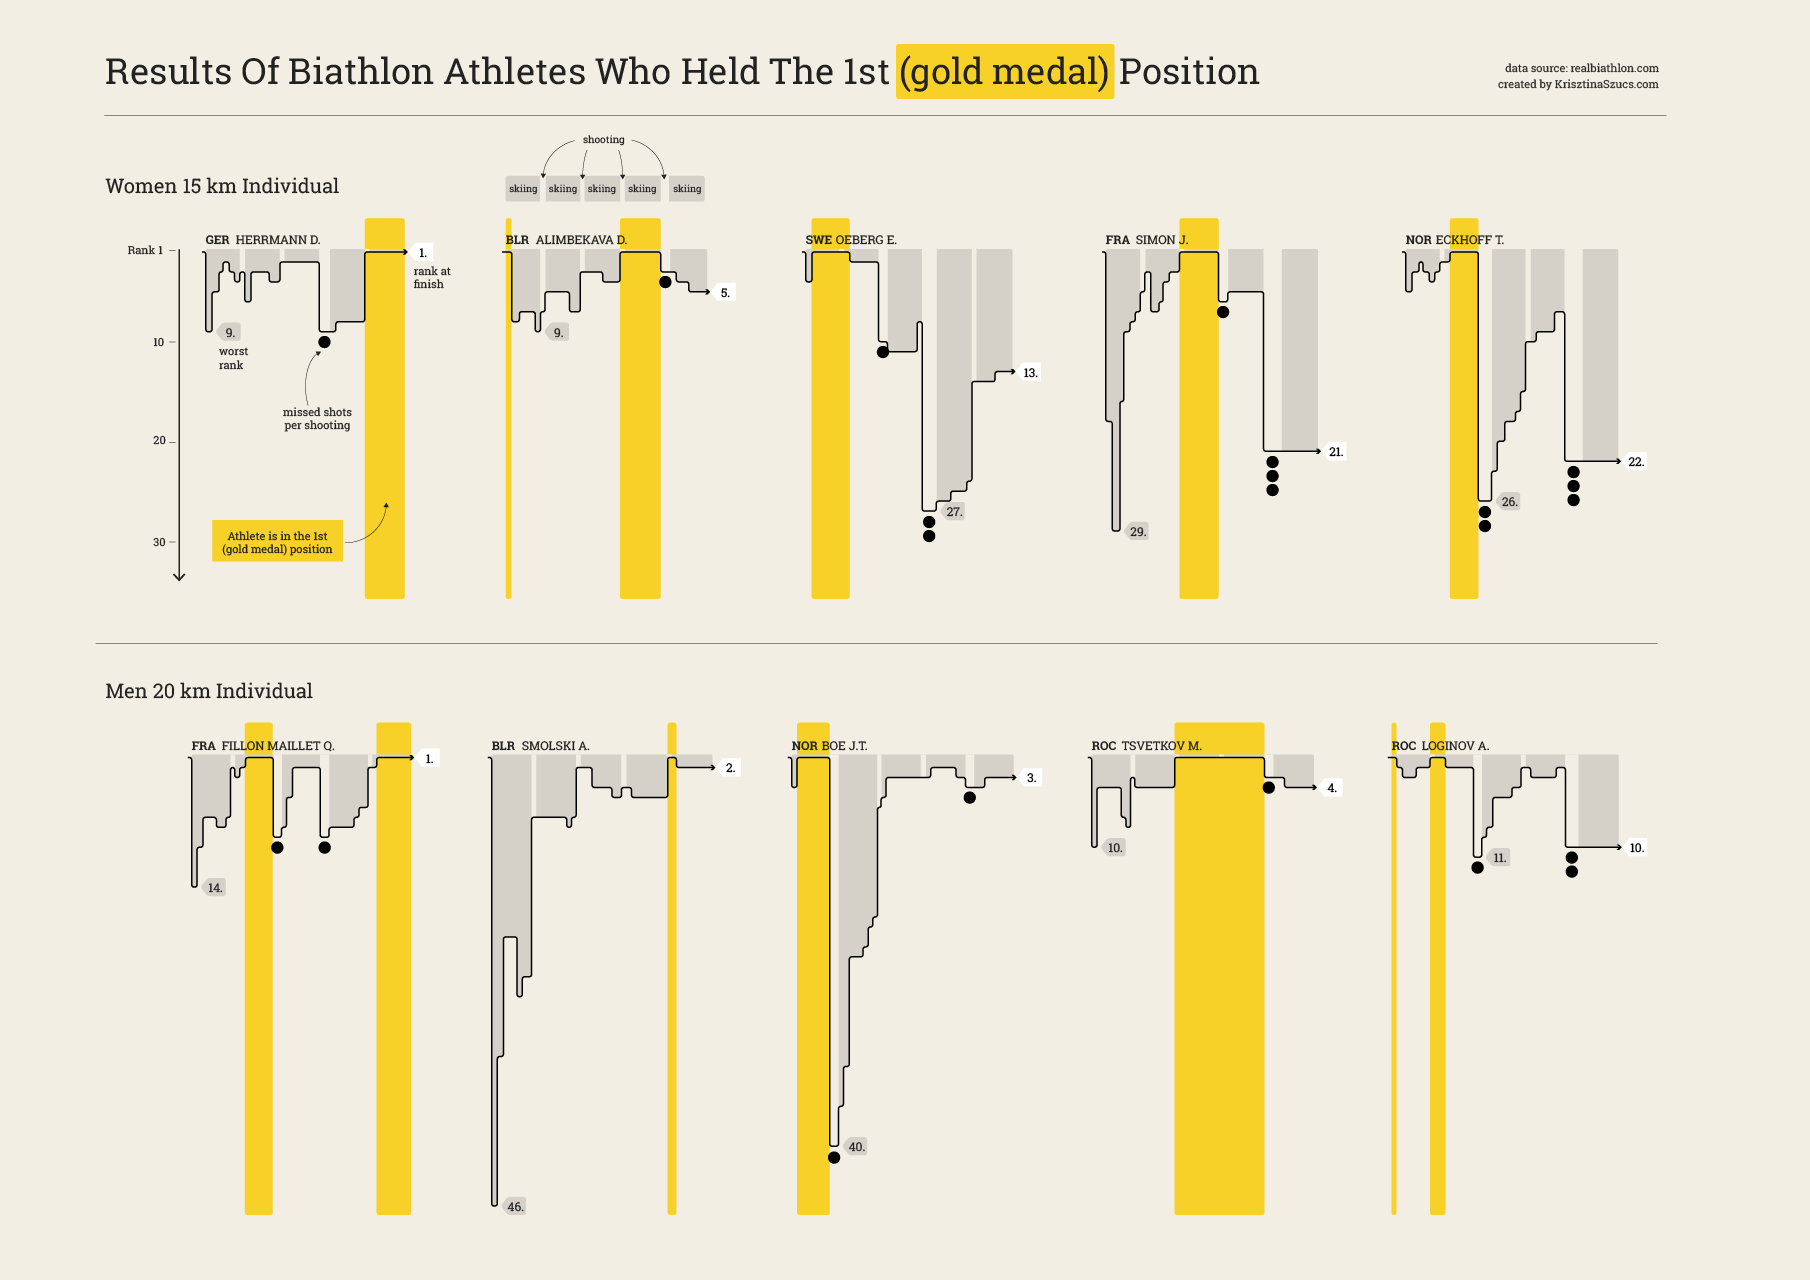
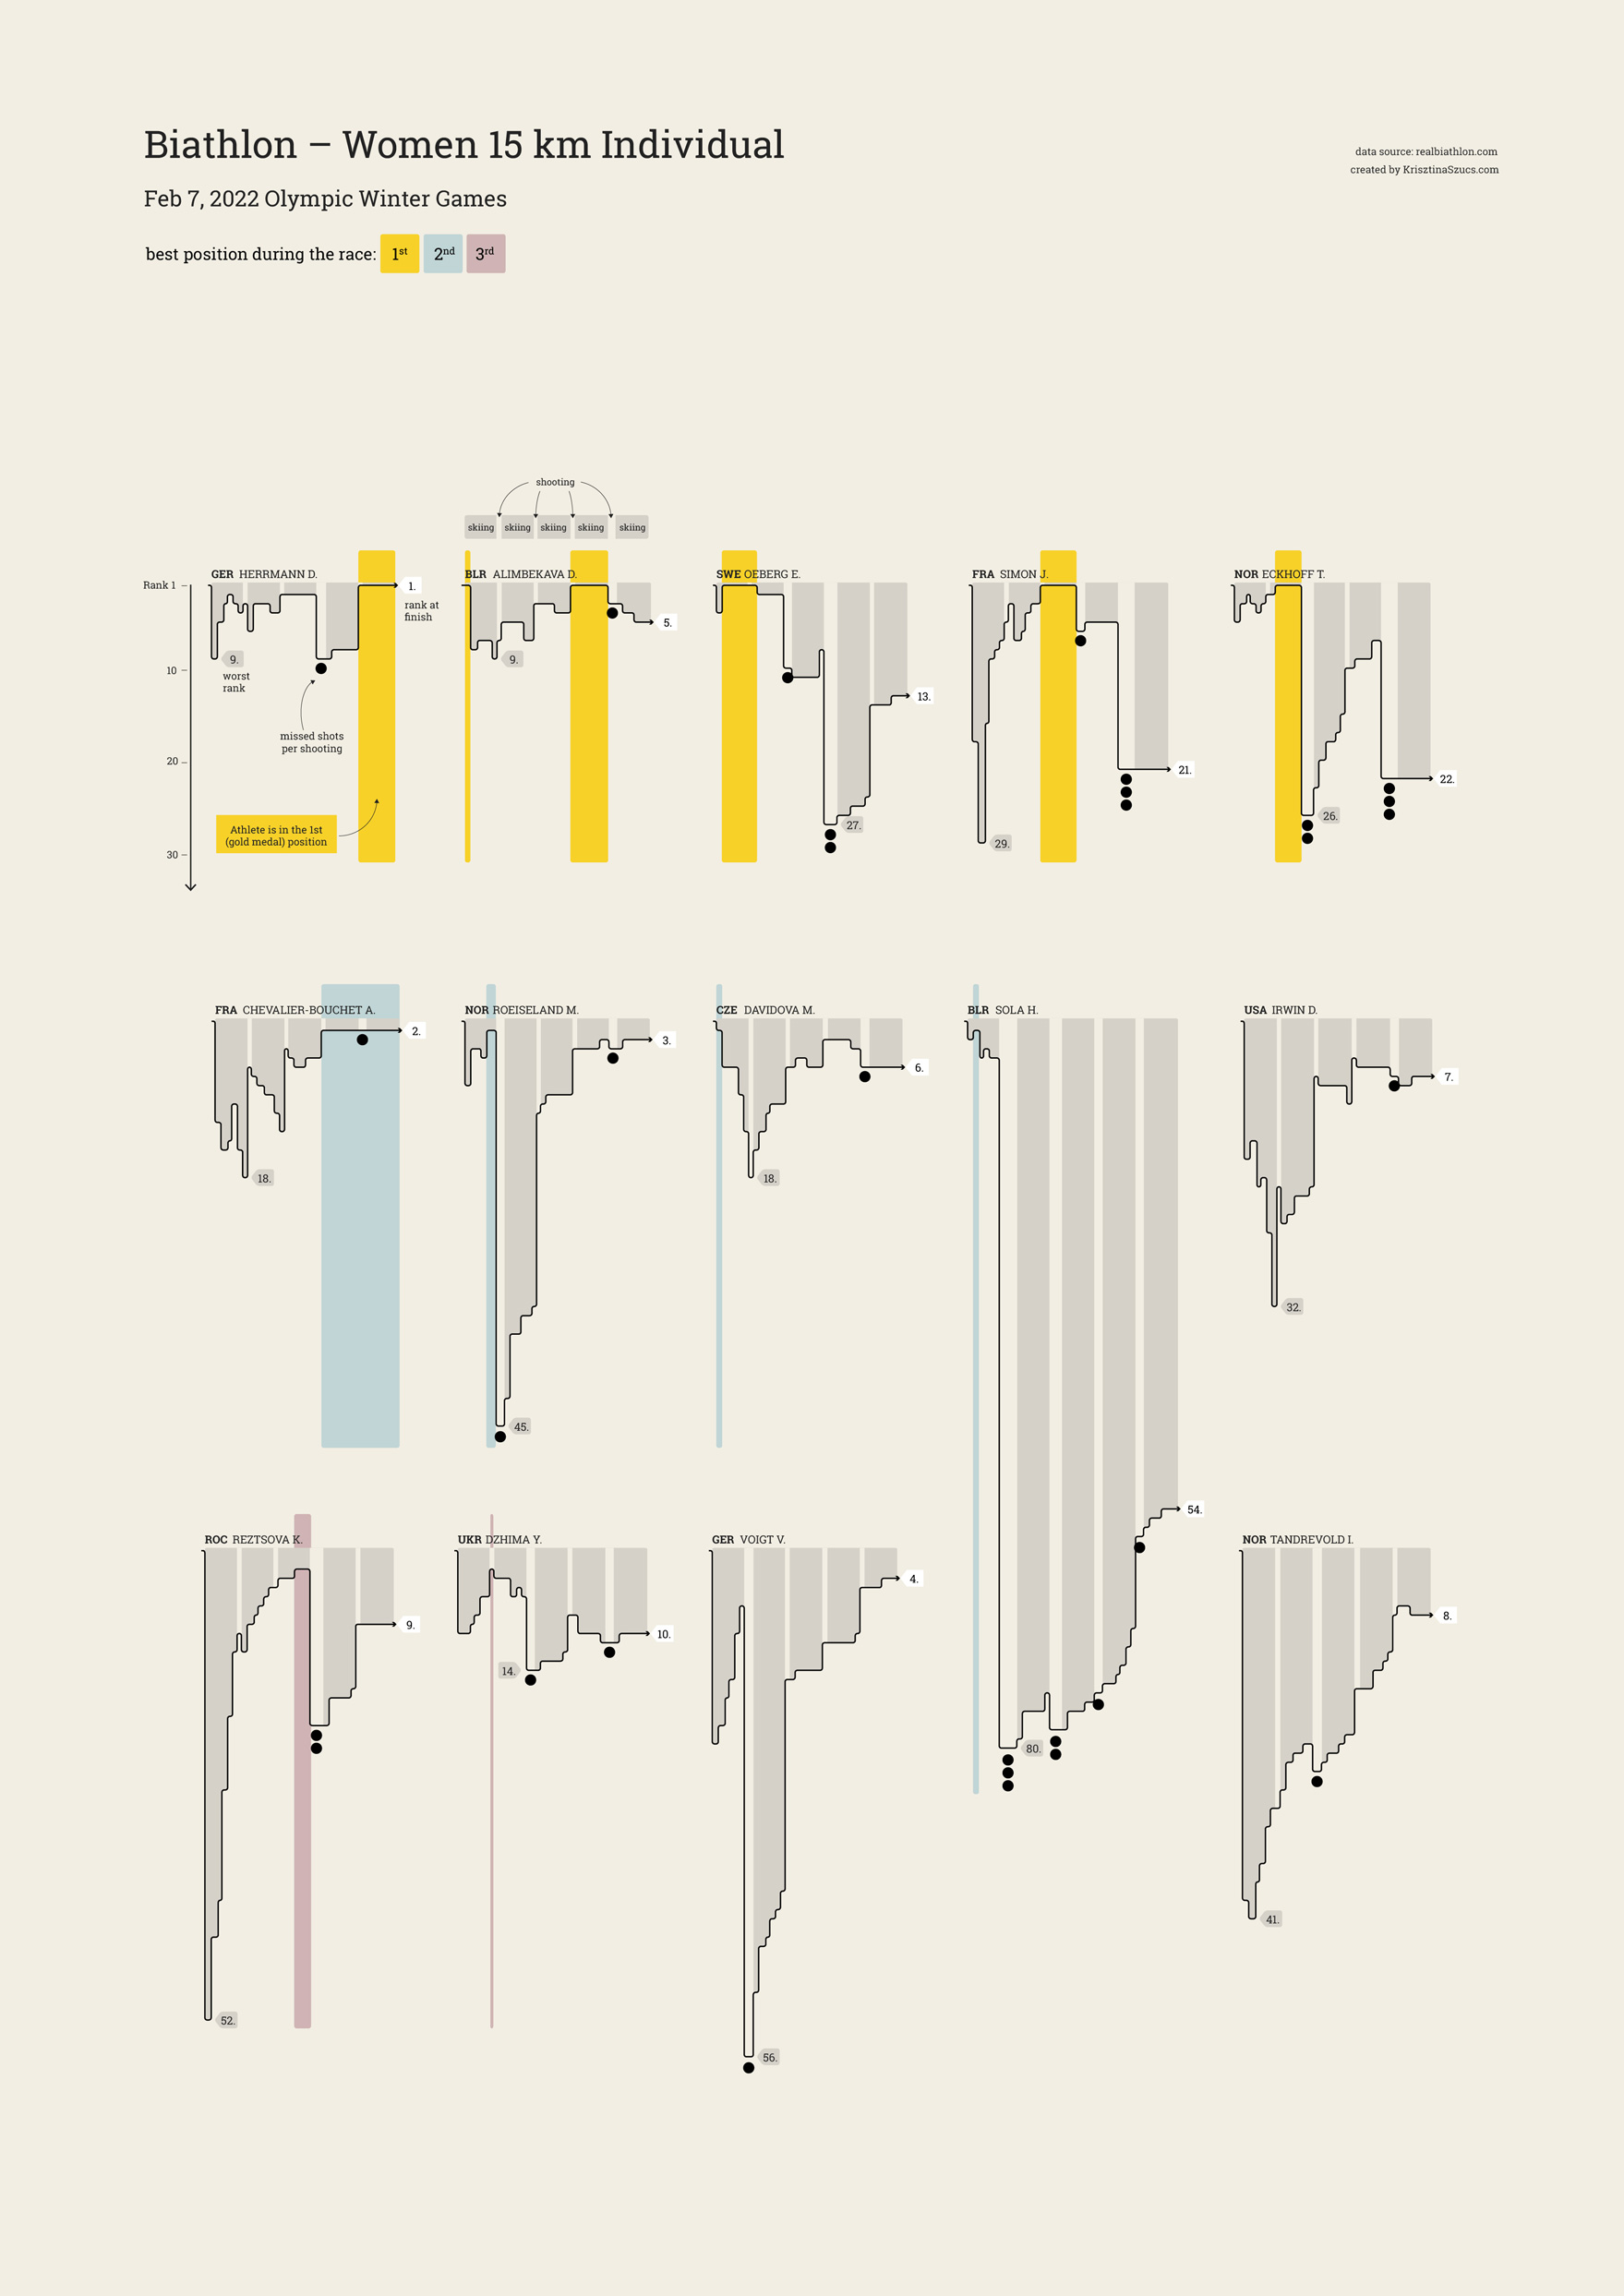
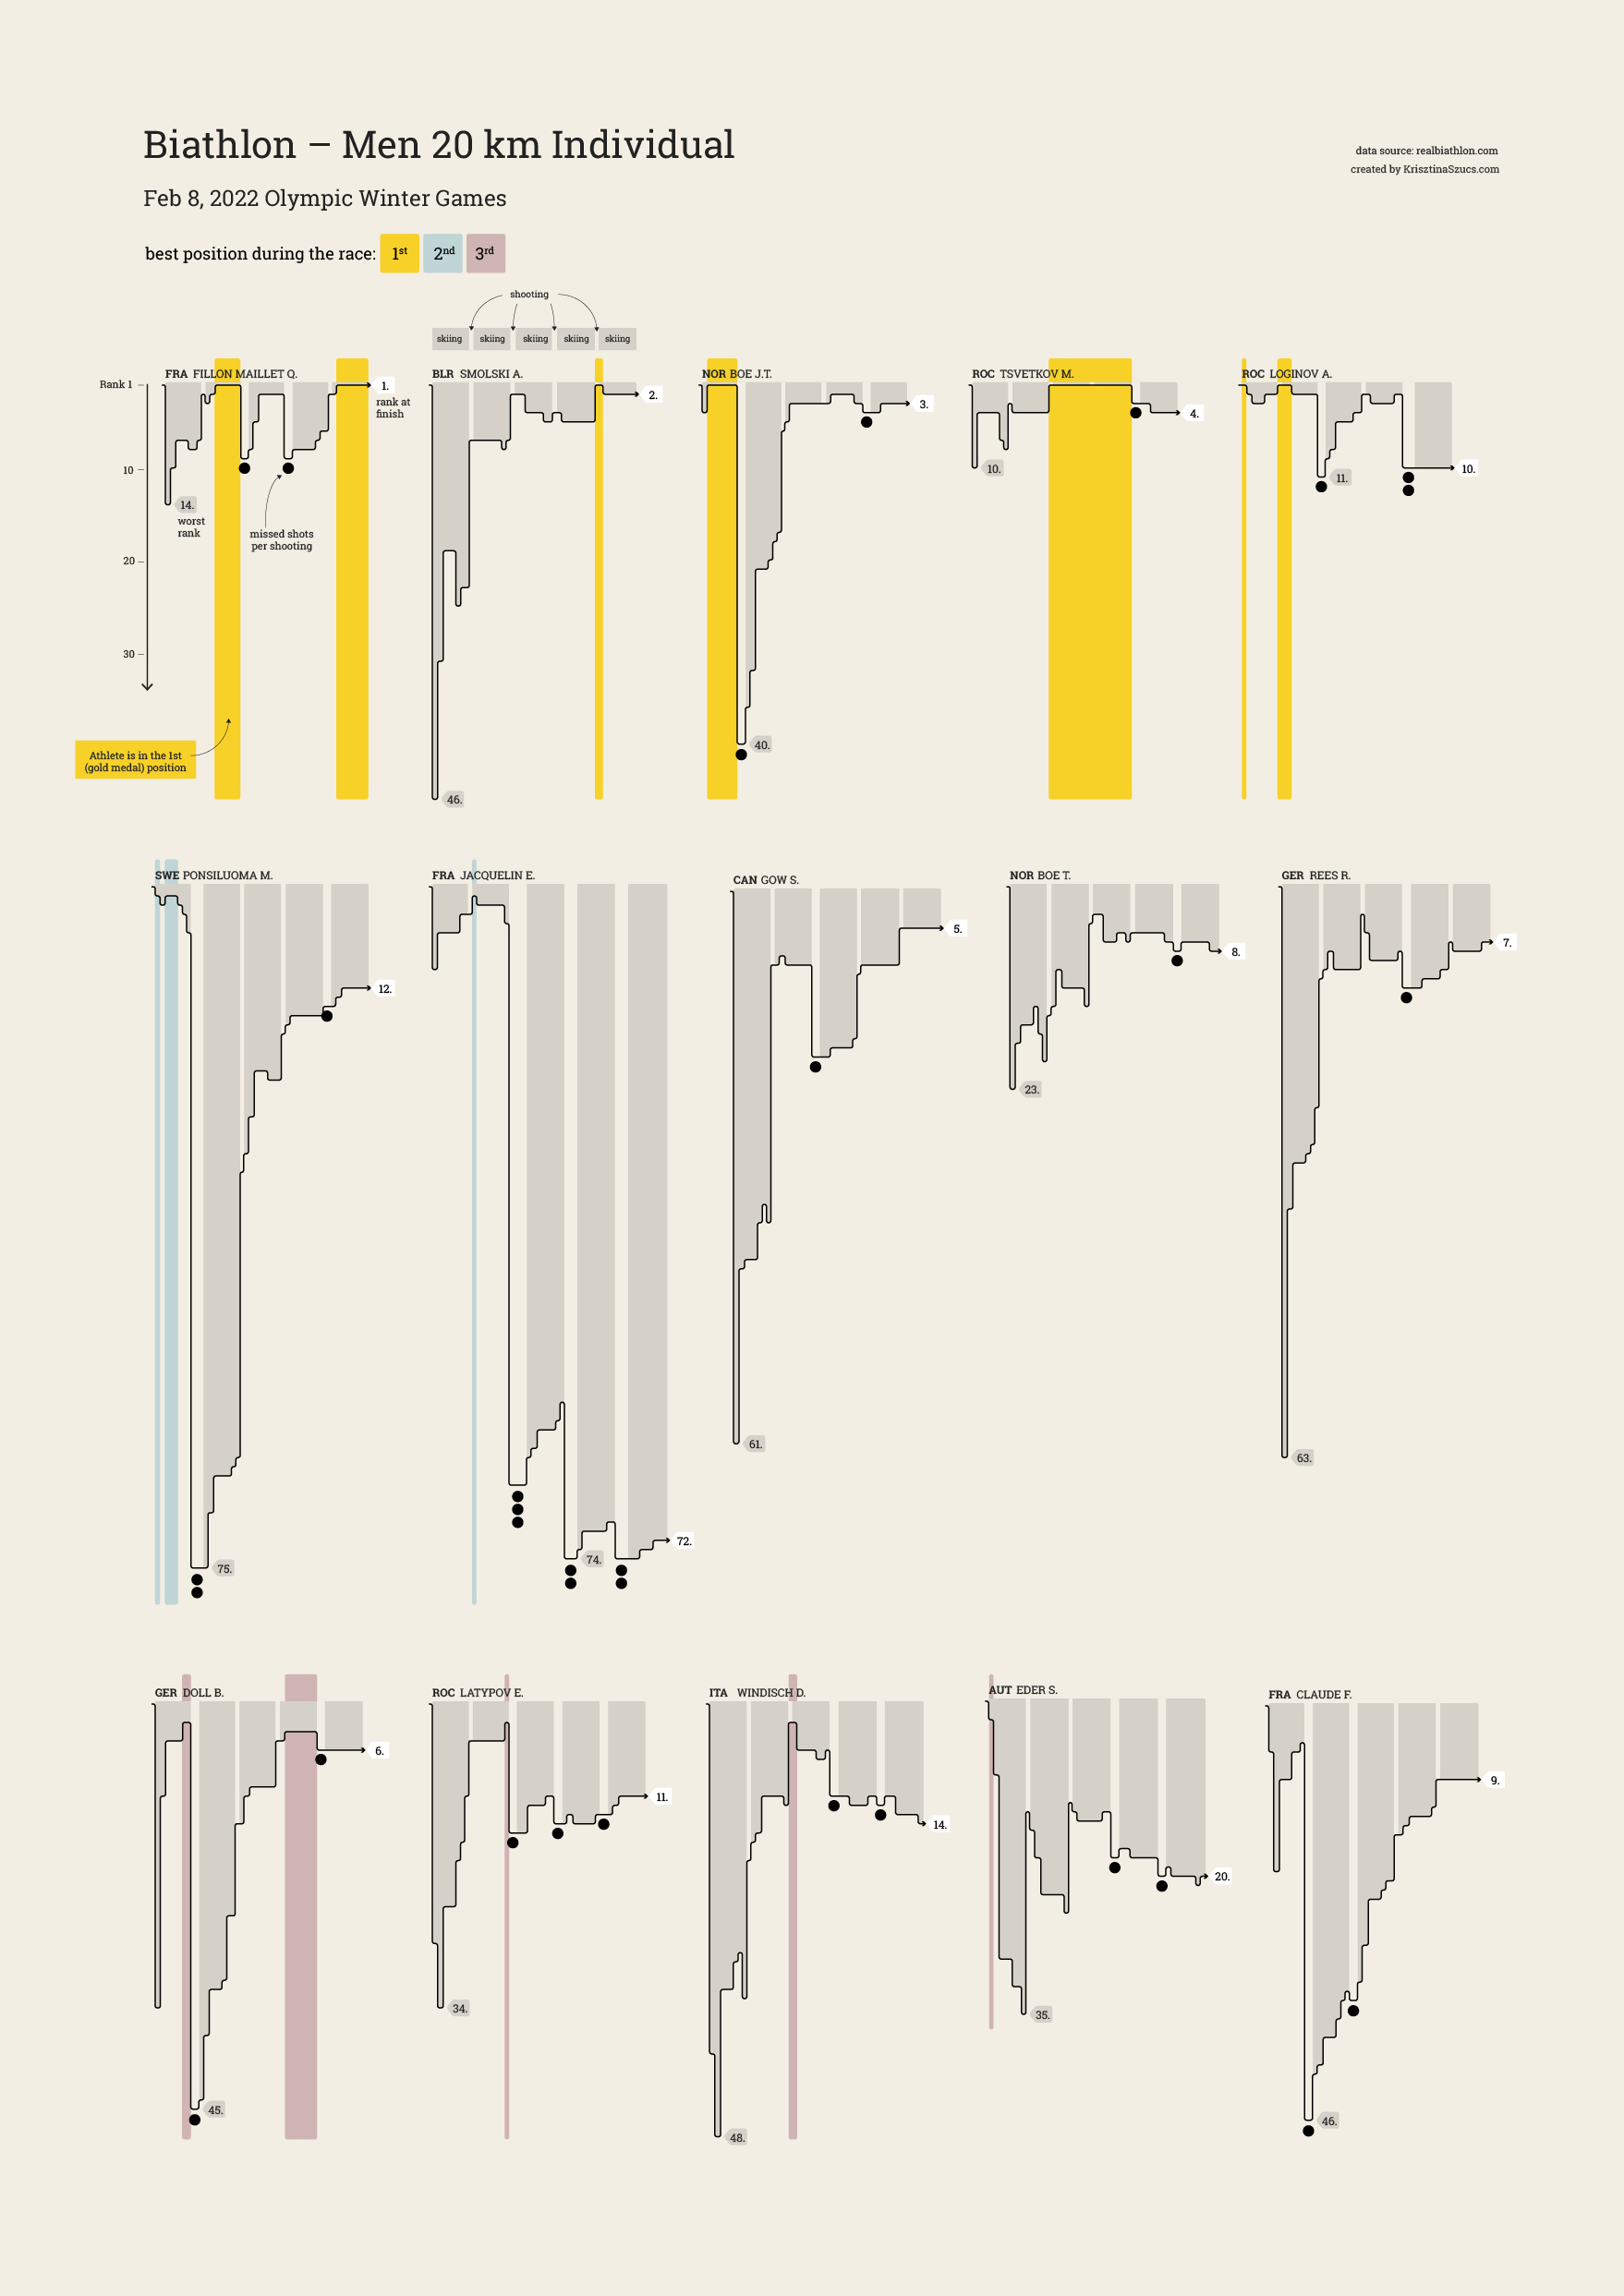
Biathlon - Beijing 2022 Winter Olympics
A biathlon race combines cross-country skiing and rifle shooting. If an athlete misses a shot they need to ski a penalty loop (or in some formats extra time gets added to their total time). This makes biathlon an intense, unpredictable sport where positions in rankings may change any second. If an athlete is a fast skier but can’t concentrate on the shooting, they can move back even 10-40 positions after a few misses. See full gallery

Circle segment - New editable chart designs on PlotParade


Waterpolo - 2022 World Aquatics Championships


Swimming - 2022 World Aquatics Championships
During a swimming event athletes swim 3 times: a heat round, a semifinal, and a final if they are in the top 8. These animations help to compare these 3 results.

Tennis - Roland Garros and Wimbledon
Tennis scoring is very complicated, it's also difficult to visualize all details that goes into a set. This visualization focuses on the sets and break (on the top) and gives a quick glimpse into all points, rallies and lost break points that defines a match.

.gif)

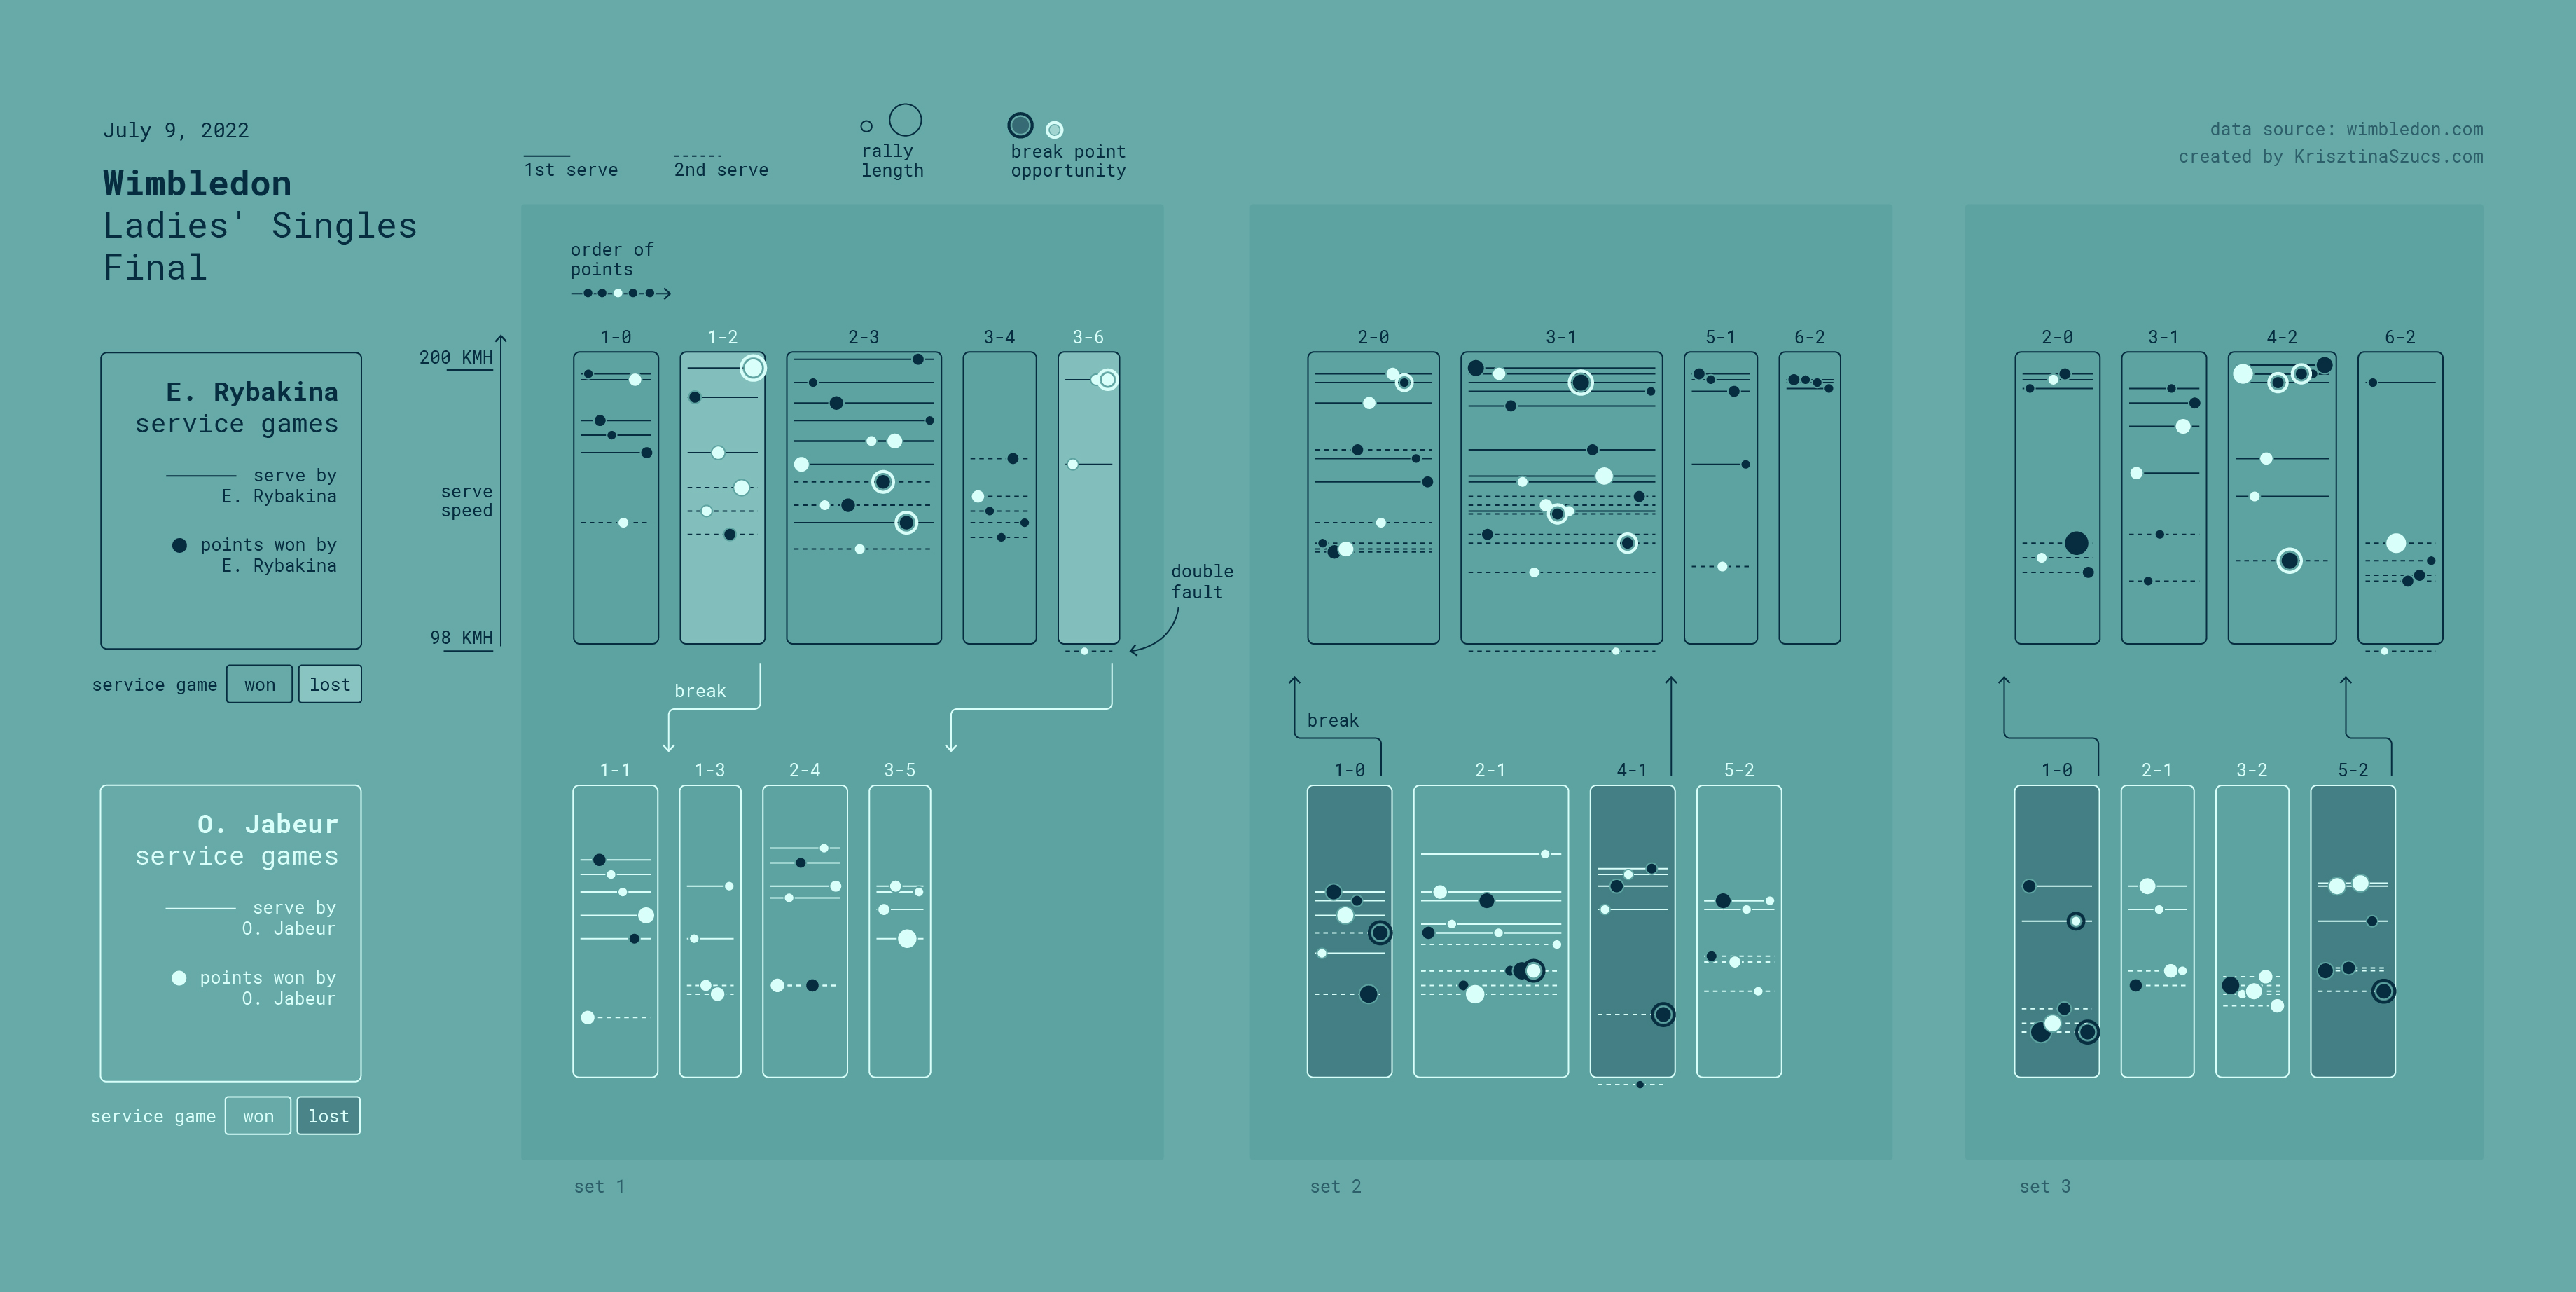
Tennis v.2 - Wimbledon
I created a more detailed static visualization for Wimbledon. I kept every detail: serve speed, 2nd serves, double faults, rally lengths, all in one image. The expectation is that a player will hold their serve, so I'm focusing on the lost service games. 3 matches of Djokovic and Kyrgios .

Ice Hockey - Beijing 2022 Winter Olympics
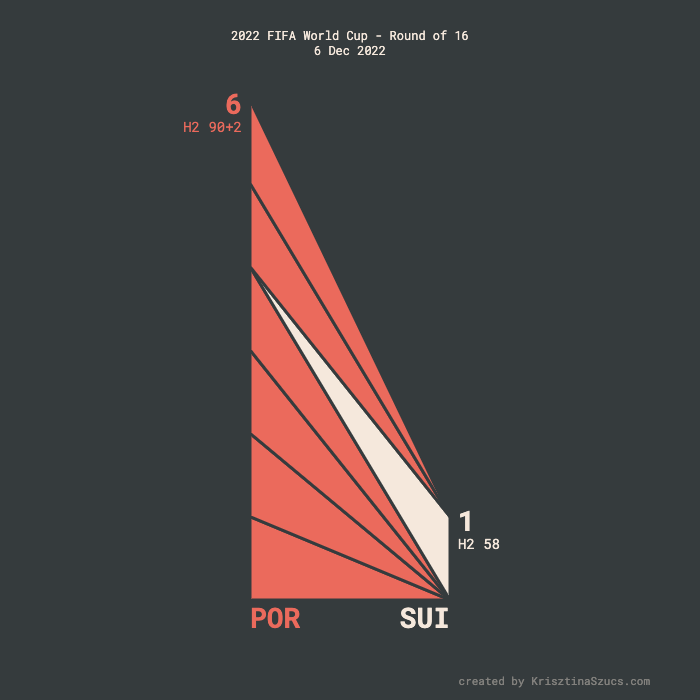
Soccer - 2022 FIFA World Cup

New personal website


What else happened
I was a judge in two categories at Information Is Beautiful Award
I talked about my PlotParade project at a DVS Fireside chat
I spoke about my sport animations at Budapest BI Forum
I taught data visualization at MOME Open
Follow me on twitter or mastodon to get a sneak peek into my latest projects.